Identify and Release Your Biggest Constraint
This guide introduces a practical, systems-level approach to continuous improvement, grounded in the Theory of Constraints. You’ll learn how to identify the biggest bottlenecks in your team’s development process, use key metrics to understand their impact, and set focused objectives to improve them. By targeting your most limiting constraint, you can unlock meaningful, measurable improvements in how your team delivers software.
Quantify Potential for Improvement
At Antenna, we categorize your metrics into two distinct but interconnected groups: Key Performance Indicators (KPIs) and Leading Indicators (LIs).
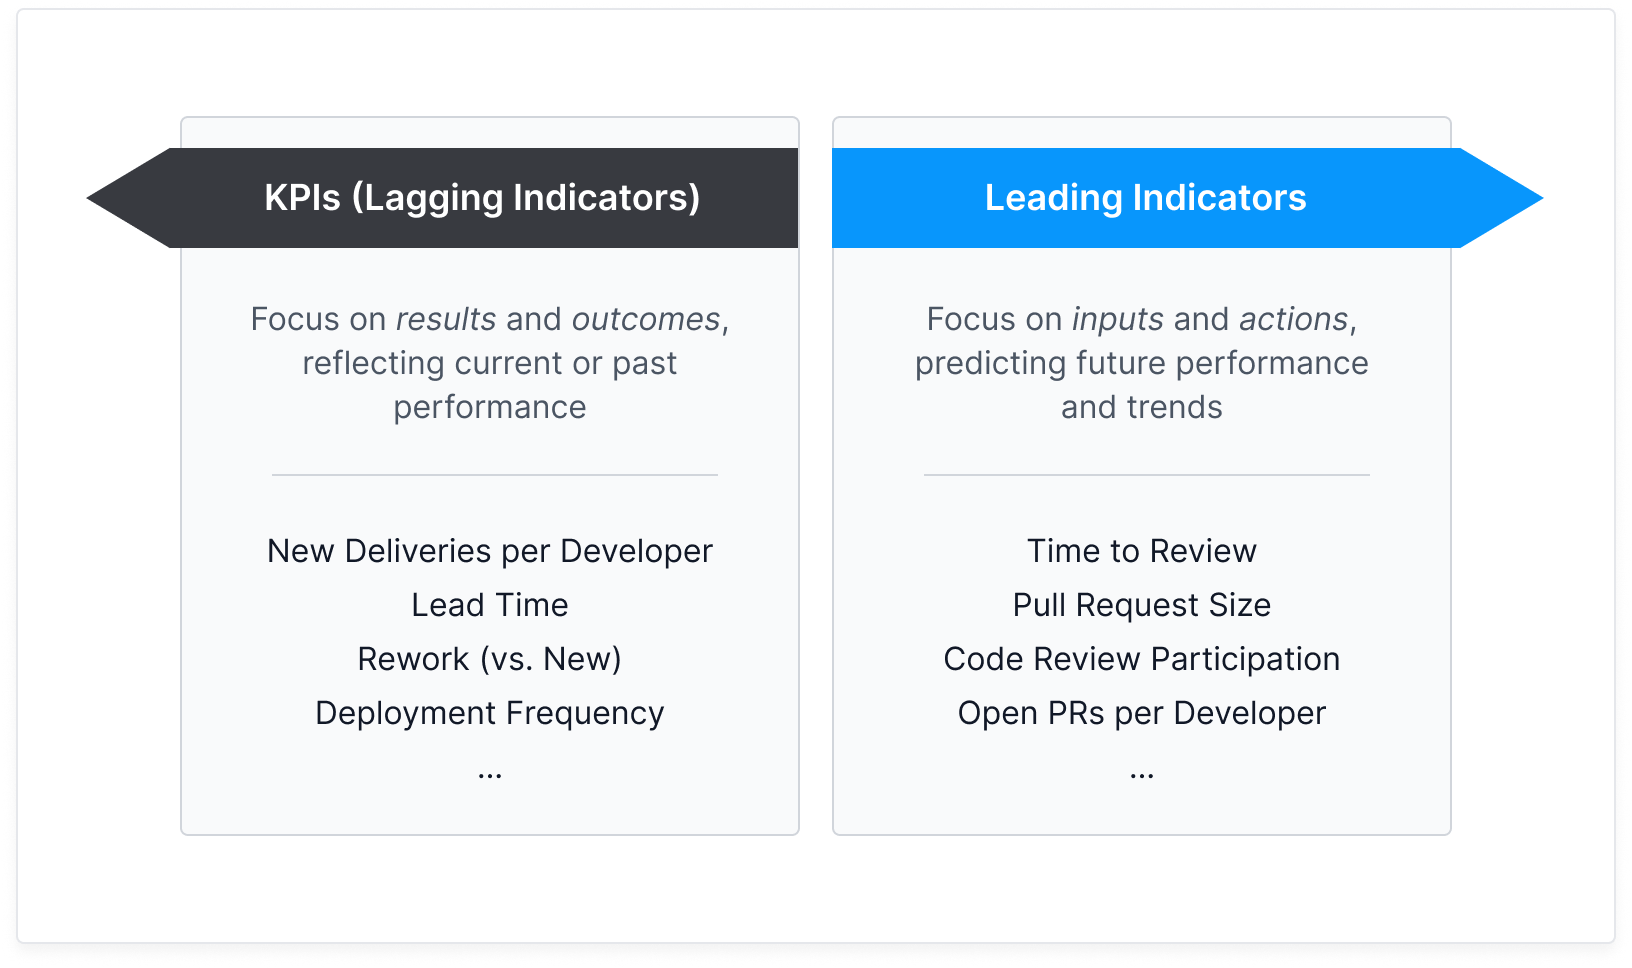
KPIs are lagging metrics that reflect the results and outcomes of your past efforts. For instance, New Deliveries per Developer measures the overall productivity of your development team, indicating how much new functionality or completed work is being shipped per individual developer.
KPIs help you quantify your potential for improvement with optimal benchmarks. As you implement changes and objectives, revisiting these KPIs regularly allows you to measure the real impact of your efforts over time.

You can monitor your team’s KPIs, such as “New Deliveries Per Developer,” on the dedicated KPIs tab within Antenna. You can view company-level performance or apply filters to focus specifically on your team’s metrics, providing a high-level overview of productivity.
Identifying Constraints with Leading Indicators
While KPIs tell you what happened, Leading Indicators focus on why it happened and what you can do about it. They are forward-looking metrics that focus on inputs and actions, designed to predict future performance and trends (your KPIs). The power of leading indicators lies in their actionability: they help you quickly pinpoint the biggest constraint in your development process.
We highlight one high-impact area at a time, making it easy for you to take action without being buried in dashboards or noise. Start by filtering the data to your specific team to see bottlenecks that are most relevant to you.
Imagine your development process like a highway. If traffic is backed up at one point, increasing speed limits on other stretches won’t help. The most effective way to improve flow is to clear the bottleneck causing the jam—only then can the entire system move faster and more smoothly.
We automatically flag the stage in your development pipeline where uncompleted work is piling up and the stage that takes the longest to complete. This indicates a “traffic jam” in your process.
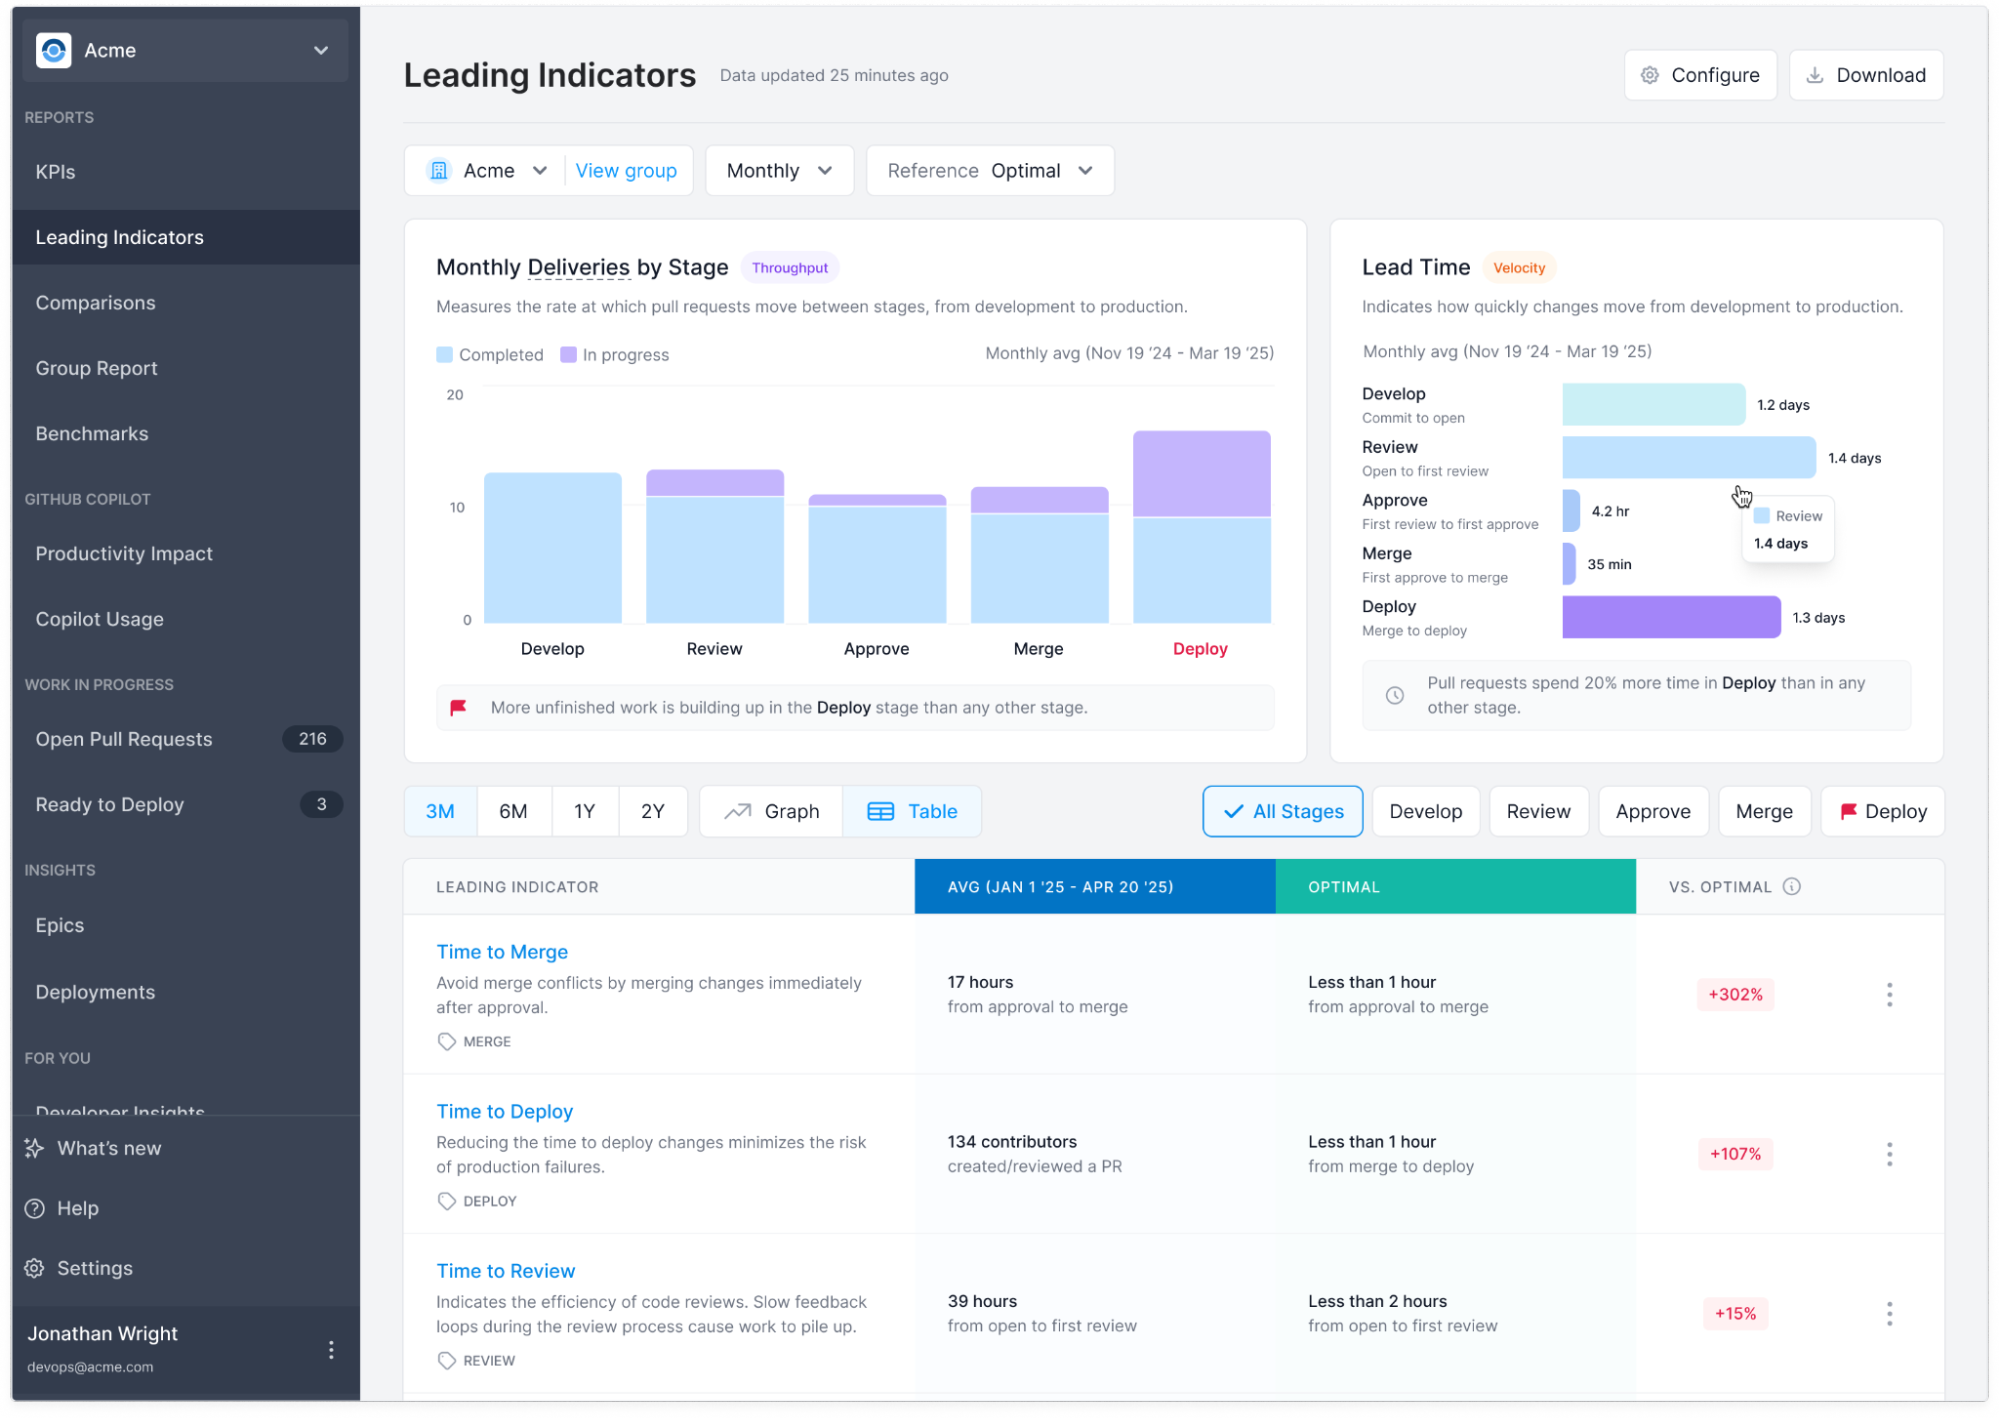
Each stage flagged as a bottleneck is backed by additional supporting Leading Indicators to help you understand why it’s slowing down. For example, in the Review stage, you’ll see contributing metrics like Pull Request Size and Code Review Participation—factors that directly impact how quickly and effectively code gets reviewed.
Look for the supporting metric with the biggest deviation from optimal. This is your top candidate for setting an objective.
Case Study: Boosting Innovation in Life Sciences & Tech
A global leader in life sciences and technology faced a common challenge: their code review process was taking too long, and features were growing unmanageably large. This lack of visibility into their development process created hidden inefficiencies, trapping potential productivity.
By addressing bottlenecks surfaced by Antenna, the company unlocked significant productivity gains. They slashed review times by 38% and pull request size by 29%, and as a result, saw a 45% reduction in overall lead time and a 17% increase in new deliveries per developer.
Taking Action with Objectives
Objectives create a clear path from actionable inputs (Leading Indicators) to better outcomes (your KPIs). By setting a goal against a specific constraint, you can confidently drive measurable improvements throughout your entire development process.
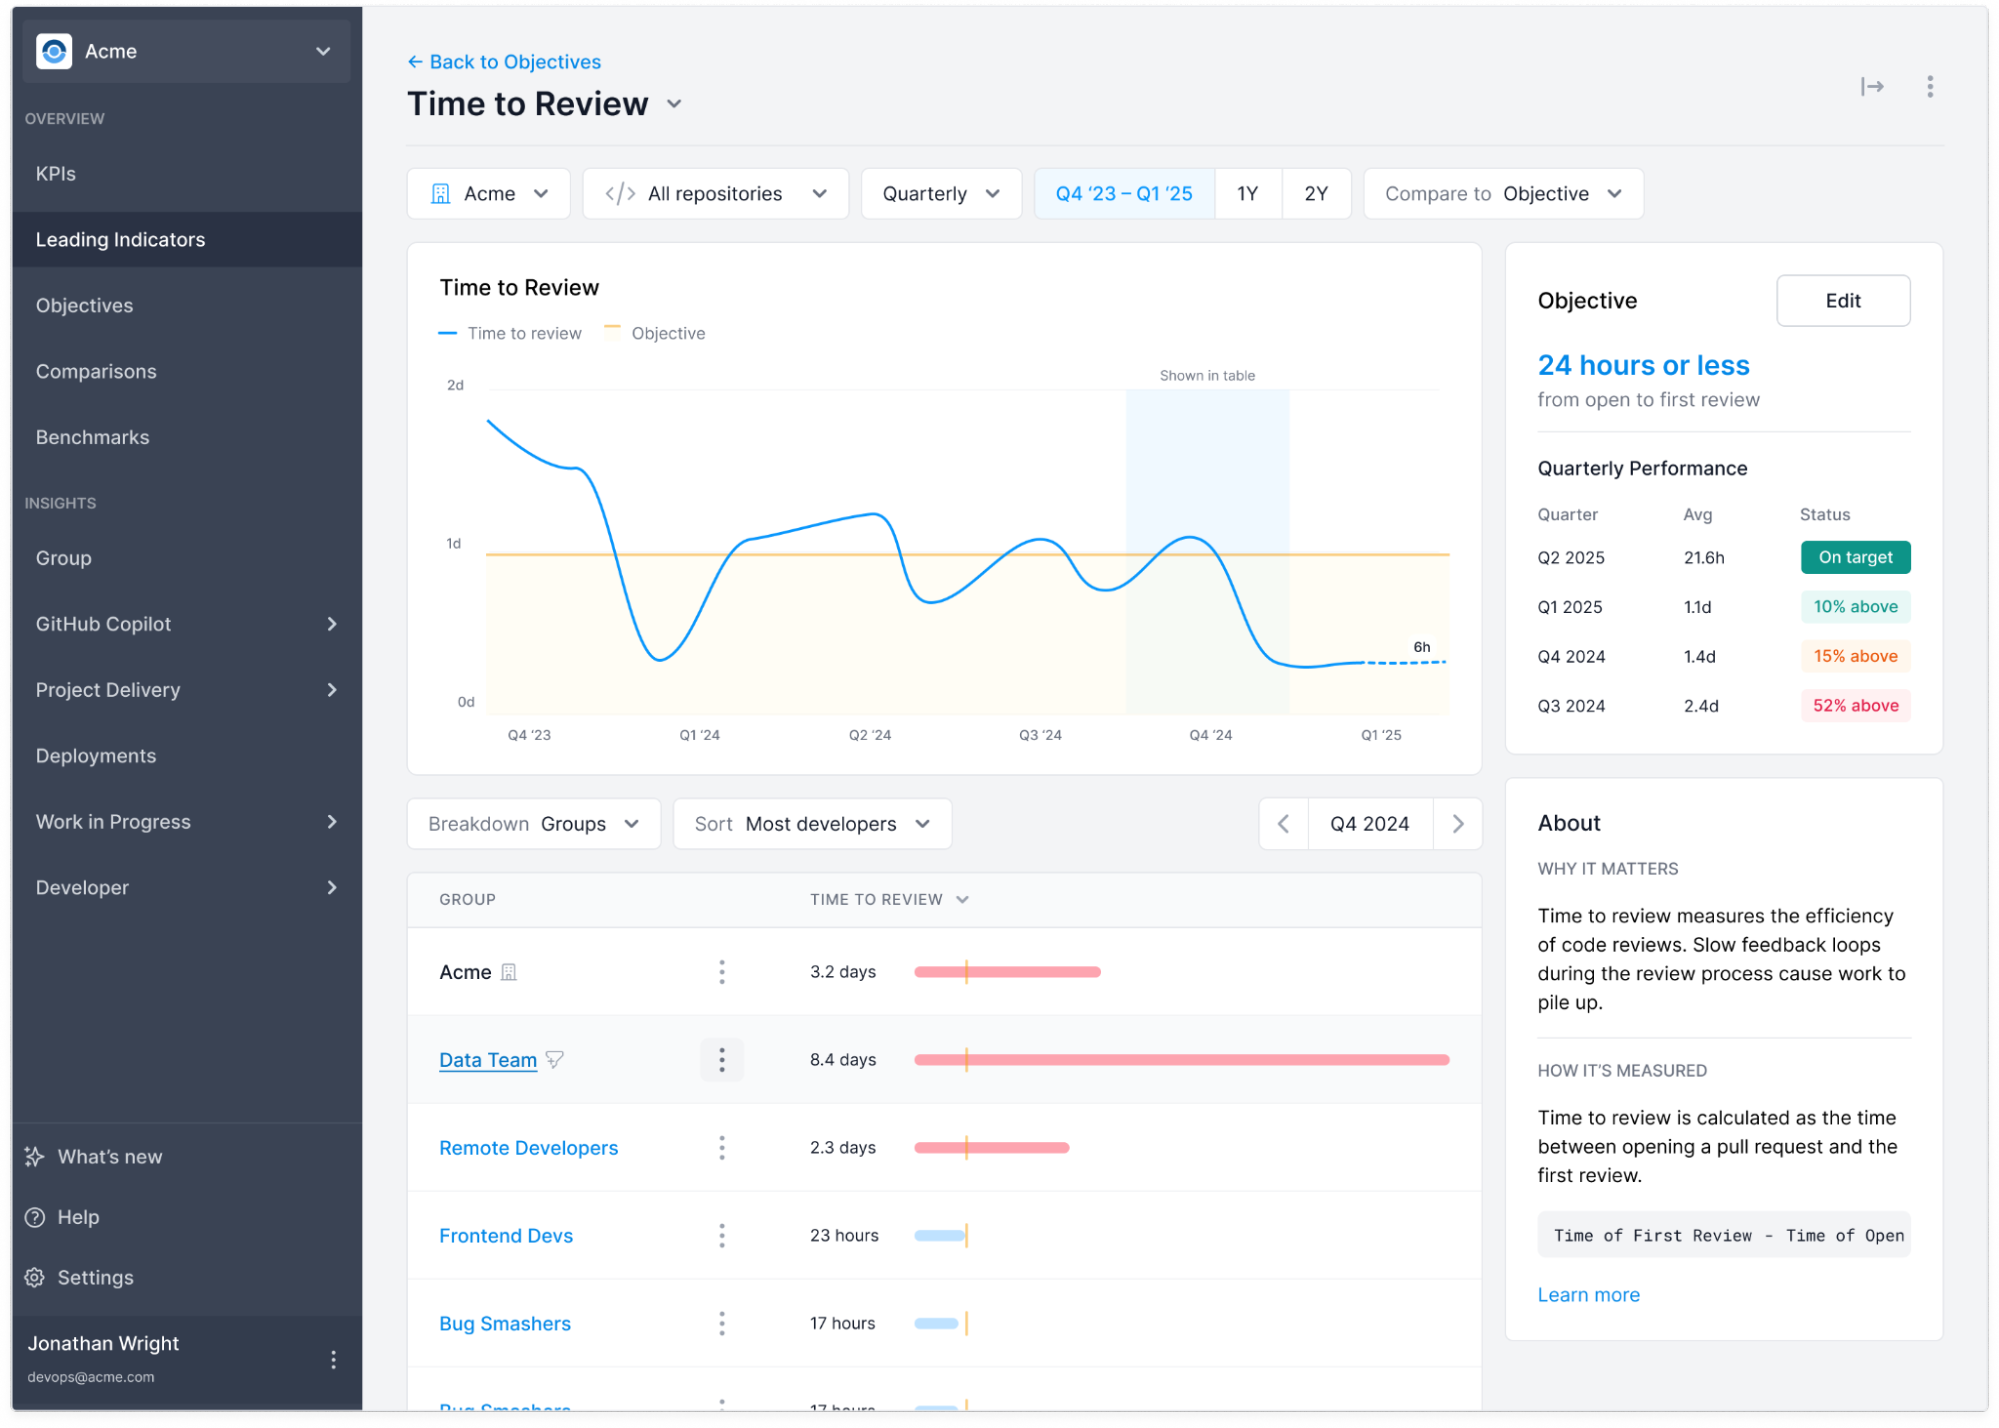
To stay focused and maintain momentum, we recommend choosing targets that are realistic and achievable within a reasonable timeframe—typically a quarter. When setting an objective, you will see additional context, including historical averages and optimal targets, to guide your decision.
Once an objective is in place, you can track progress in the Objectives tab. This view lets you monitor objectives across the entire company, organized by team or objective type. To focus on your own team’s progress, simply apply a team filter for a more targeted view.
Continuous Improvement
Constraints change over time. Once you successfully release one constraint, a new one will surface elsewhere in your system. This dynamic helps drive your continuous improvement cycles.
With each successful objective, return to the KPIs tab to measure its top-level impact on your team’s overall productivity, velocity, and quality. This completes the feedback loop, quantifying changes to productivity over time and guiding you to the next area for optimization.